The 180-Point Inspection: Inspect Your Digital Showroom Before Shoppers Hit Your BDC
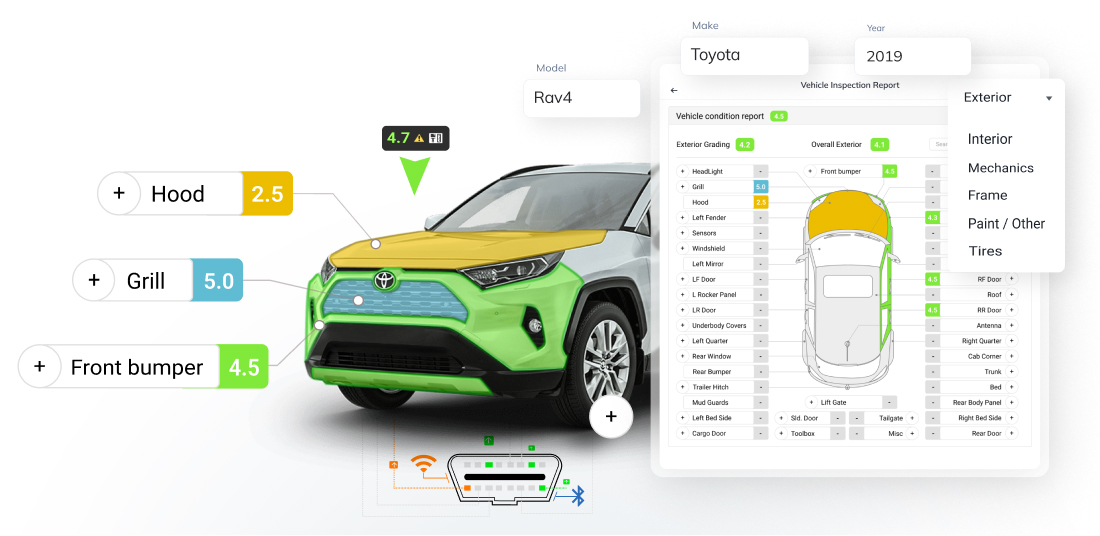
You inspect every vehicle before it hits the lot.
But when was the last time you inspected your digital showroom before shoppers hit your BDC?
Every day, dealerships invest heavily in traffic, inventory tools, and third-party listings—yet the dealership website itself often goes unexamined. Small friction points, weak appointment paths, and hidden SEO gaps quietly cost stores real units every month.
That’s why Car180 built the 180-Point Inspection.
What Is the 180-Point Inspection?
The 180-Point Inspection is a comprehensive diagnostic of your dealership’s online performance, built specifically for automotive retail.
It measures how effectively your website:
- Captures local demand
- Converts mobile traffic
- Routes leads to your BDC
- Creates appointments
- Recaptures lost visitors
- Supports long-term SEO growth
Each category is scored out of 30 points, for a total opportunity score of 180.
Breakdown of the 6 Core Categories
1. Traffic & Market Visibility
Score Example: 18/30
Are local shoppers finding you before they find your competitors?
We analyze:
- Local search presence
- Market share visibility
- High-intent keyword coverage
- Inventory search alignment
- Competitive positioning gaps
A weak score here means demand exists—but your competitors are capturing it first.
2. Mobile Conversion Performance
Score Example: 22/30
More than half of dealership traffic is mobile. But is your mobile experience converting—or repelling?
We evaluate:
- Page speed
- Tap-to-call efficiency
- Form usability
- CTA visibility
- Scroll depth friction
Even a one-second delay or poorly placed button can dramatically impact lead volume.
3. Lead Capture Friction
Score Example: 24/30
How many required fields stand between a shopper and your BDC?
We measure:
- Form length and required fields
- Multi-step barriers
- Redundant information requests
- Trade-in process friction
- Credit app drop-off risk
The more friction you add, the more silent exits you create.
4. Appointment Path Strength
Score Example: 20/30
Can a visitor book an appointment in under 15 seconds?
We examine:
- Appointment button visibility
- Click-to-calendar functionality
- Confirmation clarity
- Routing logic to BDC
- CTA consistency across pages
If the path to appointment isn’t obvious and fast, shoppers delay—and delay kills momentum.
5. Engagement & Retention Triggers
Score Example: 26/30
Are you recapturing visitors who leave without converting?
We review:
- Retargeting infrastructure
- CRM remarketing alignment
- Exit-intent logic
- Email capture positioning
- Behavioral tracking setup
Most dealership traffic leaves without converting. The question is whether you’re bringing them back.
6. BDC Enablement Infrastructure
Score Example: 16/30
Is your site built to feed your BDC pipeline—or just generate form fills?
We analyze:
- Lead routing clarity
- CRM integration
- Response workflow alignment
- Attribution tracking
- Data visibility for managers
Traffic doesn’t sell cars. Conversations do. And your website should be engineered to support them.
Sample Opportunity Score
Total Score: 126 / 180
Status: NEEDS ATTENTION
From this example, we estimate:
- Missed Leads per Month: ~47
- Estimated Missed Units: 8–12
- Revenue Impact: $240,000+ per year
These aren’t theoretical losses. They’re operational blind spots.
Why This Matters
Dealerships routinely inspect vehicles, audit inventory, and review sales performance—but rarely conduct a structured inspection of the digital systems feeding their pipeline.
Your website is your highest-volume showroom. If it underperforms by even 10–15%, the long-term revenue impact compounds quickly.
The 180-Point Inspection gives leadership clarity:
- Where demand is leaking
- Where friction is killing conversions
- Where BDC alignment is breaking down
- Where growth is realistically achievable
Inspect What Feeds Your Floor Traffic
Before you increase ad spend.
Before you add more third-party listings.
Before you blame your BDC.
Inspect your digital showroom.
Car180 was built to uncover what traditional analytics dashboards miss—and turn insight into measurable dealership growth.
About the Author: Car180 is a dedicated content creator at Car180, focused on delivering insights about automotive marketing, dealership growth, and digital strategies.